But before we start a little bit about our project:
It’s a fully automated digital bank. We built dynamic products that are fully digitalized, without any manual steps, with all the “magic” happening in real-time and out of the customer’s view.
We are using Kubernetes to run all our products and I would like to make some introductions on how to start.
We need running k8s cluster, that we could achieve in two ways:
- Locally using minikube or docker desktop. The most simple way to run Kubernetes locally is the Docker desktop.
- Any public cloud provider supporting K8S
PS: Will be applied additional charges also need to have additional specific knowledge of the selected cloud provider for set up.
After the K8s cluster up and running, we need to set up kubectl to access the cluster.
Kubectl – native CLI tools to manage Kubernetes from remote host.
Kubernetes itself is a great tool but it’s about a lot of work with CLI, which is not very easy from the start, black screen, and no visualization.
Also, Kubernetes lacks monitoring and deployment out of the box.

Let’s combine tools that are really worth using and that will make your life easy.
ArgoCD – deployment tools (Ci-Cd native k8s tools)
Grafana, Prometheus, (Loki – separate deployment for logging) stack – monitoring tools
Here are some nice features of Argocd:
- Visualization of any difference between app versions
- Access app logs instantly from the same view
- Visualization of app status and deployment status
- Changes to any object
- Notification to email, Slack, etc.
- Metric endpoint to Prometheus also there is prebuild dashboard for Grafana
- Argocd don’t have DB all data is saved as K8s objects
- Support multiple cluster setup
- Have CLI tool
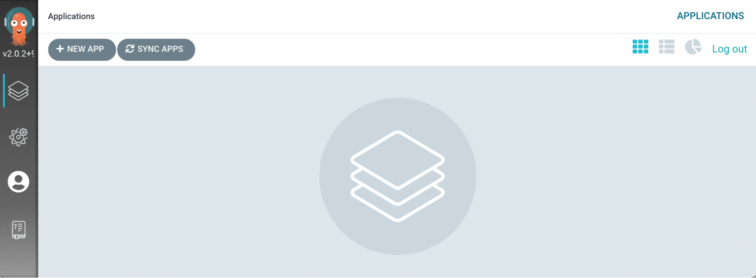
First, we need to setup Argocd which is really easy to do
Run-on terminal with kubectl:
Source: https://argo-cd.readthedocs.io/en/stable/getting_started/
kubectl create namespace argocd
kubectl apply -n argocd -f
https://raw.githubusercontent.com/argoproj/argo-cd/stable/manifests/install.yaml
Get password: kubectl -n argocd get secret argocd-initial-admin-secret -o jsonpath=“{.data.password}“ | base64 -d
(PS: Password generated automatically and put into a secret, but could be changed later.
Run below command and wait until pods status Running:
kubectl -n argocd get pods -w
Configure port forwarding to access Argocd from your browser:
kubectl port-forward svc/argocd-server -n argocd 8080:443
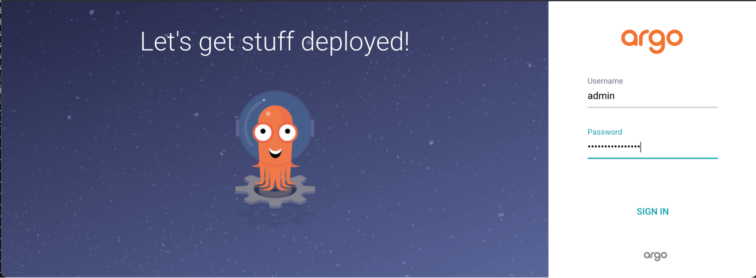
Let’s access Argo from your browser:
https://localhost:8080
Now we have a really powerful and easy-to-use tool running on our cluster so we could deploy any chart in a matter of seconds and see the result.
The second tool in which we are interested is – Monitoring stack.
Next, we will use helm charts, the helm is a package manager for Kubernetes.
For this purpose, we will use the Prometheus community charts, from this git source.
All we need is copy helm repo Url “https://prometheus-community.github.io/helm-chart”
To create a new application for monitoring tools, in Argocd press NEW APP:
Name it: monitoring
Select: auto-create namespace
Put in SOURCE:
Repository URL: Url which we saved before https://prometheus-community.github.io/helm-charts/
Select HELM
Chart:
kube-prometheus-stack last-version
Namespace: monitoring
Scroll down and Change passwords if you would like
Should Be like in the picture
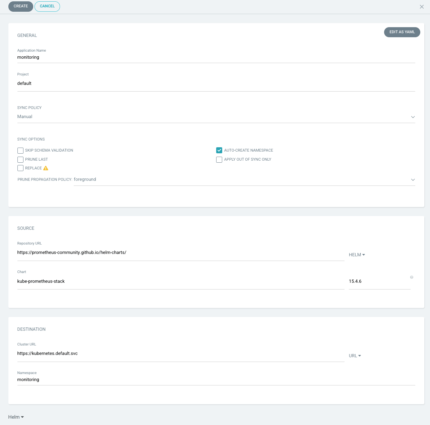
Press: CREATE
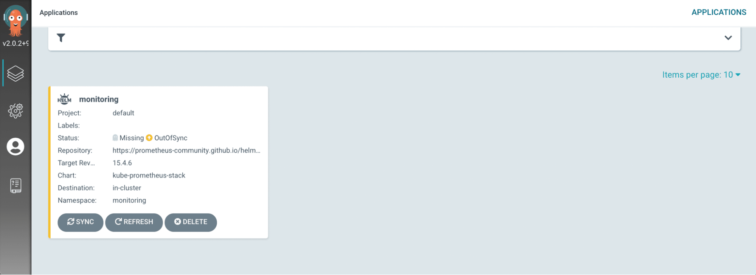
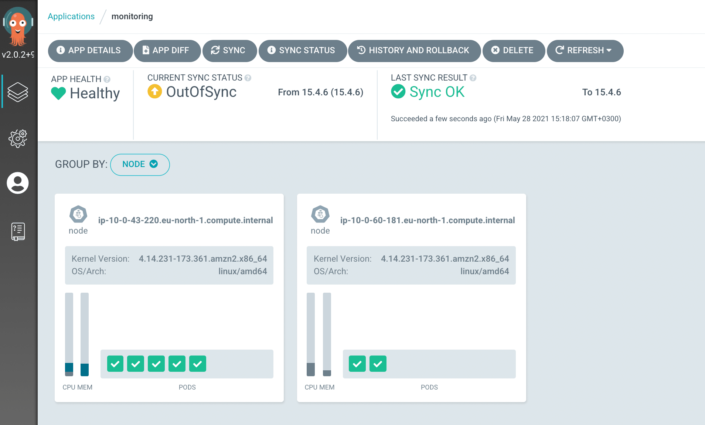
Press: SYNC
Wait until deployment is finished – Sync OK
As in the previous setup, lets forward ports:
kubectl port-forward svc/monitoring-grafana -n monitoring 8081:80
Put into your browser: http://localhost:8081
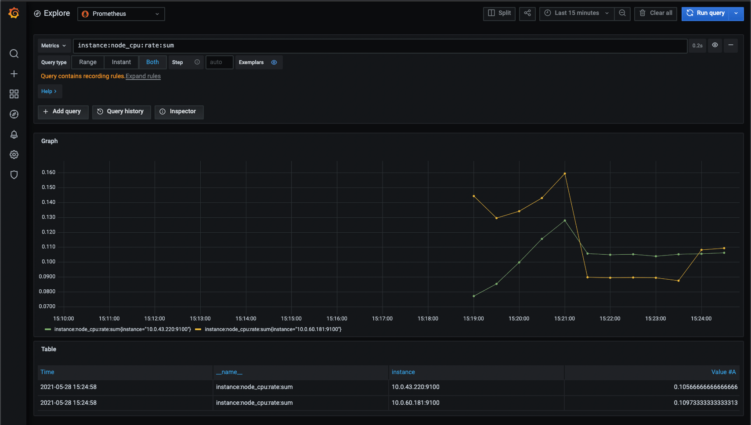
Important metrics
Here are some metrics which are very important and useful:
- Pod, Nodes: CPU, MEM, Disk usage in %
- Apps restart count
- Apps Up status
- Ingress error count compared to all traffic
- Error count in apps (additionally needs Loki)
- Also, you could find preconfigured dashboards.
We had deployed an Argocd, this tool made any deployment easy, and no need to know any CLI tool-specific. To show its power we had deployed native monitoring tools for Kubernetes with Argocd help.
Would it be complex like Monitoring stack or simple as Nginx basically would be deployed in the same manner!
Hope this will make some stuff more clear and easy to understand.
Next time I will try to look into the deployment pipeline, apps monitoring, k8s backups, and options to combine it with Kubernetes.