Artificial Intelligence (AI). It seems like every article on technology has to mention AI. At least once or twice. It’s associated with self – driving cars, Alexa from Amazon, and of course it will steal your job. For better or worse, Artificial Intelligence became a buzzword. Though it seems like a lot of people do not truly understand what it means, so let me break it down for you. The term Artificial Intelligence (AI) is based on the idea that computers or systems can learn from data and identify patterns and make decisions with minimal human intervention. The method of learning from data analysis is defined as Machine Learning (ML). It automates analytical model building and basically is a subset of the Artificial Intelligence concept.

The aim of this article is to provide a better understanding of what AI actually is. Today it plays an important role in many industries. It’s used to facilitate human workforce to achieve more by spending less. For most of us, the term Artificial Intelligence associates with complex technology. The word intelligence relates to something or someone being smarter and able to perform in a better way. And no one wants to be less smart than others, right?
So, how exactly does AI contribute to the human workforce? For example, a variety of journals are using AI for news writing and distribution. It’s no surprise that Bloomberg is one of them. Just last year their program, Cyborg, churned out thousands of articles that took financial reports and turned them into news stories like a business reporter. The education system is using AI to prepare specialized learning programs.There are several companies such as Content Technologies and Carnegie Learning currently developing intelligent instruction design and digital platforms that use AI to provide learning, testing and feedback to students from pre-K to college level that gives them the challenges they are ready for, identifies gaps in knowledge and redirects to new topics when appropriate. It’s even expected that artificial intelligence in U.S. education will grow by 47.5% from 2017-2021 according to the Artificial Intelligence Market in the US Education Sector report. The few mentioned fields are just the beginning of the AI journey into the human workforce. In the upcoming years AI will emerge in more and more industries changing the way we work entirely.
So, is it true that the terms Artificial Intelligence and Machine Learning are too hard for most of us to comprehend? To make things clearer let’s actually use an example where some concepts of Machine Learning can help a business achieve more by spending less.
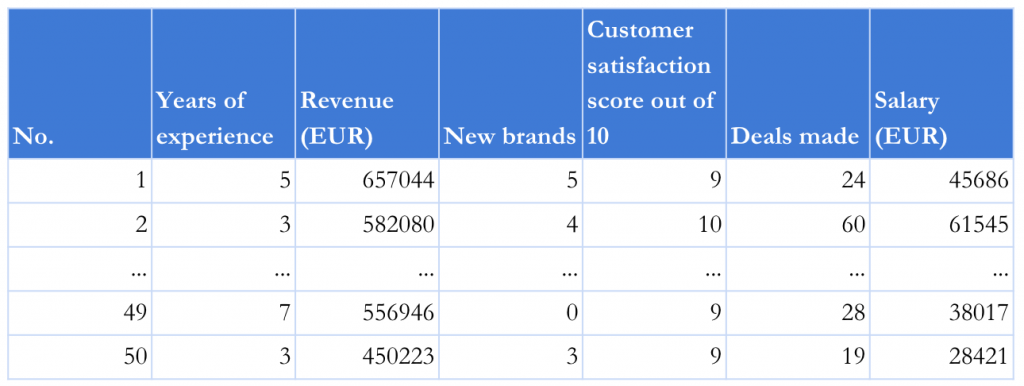
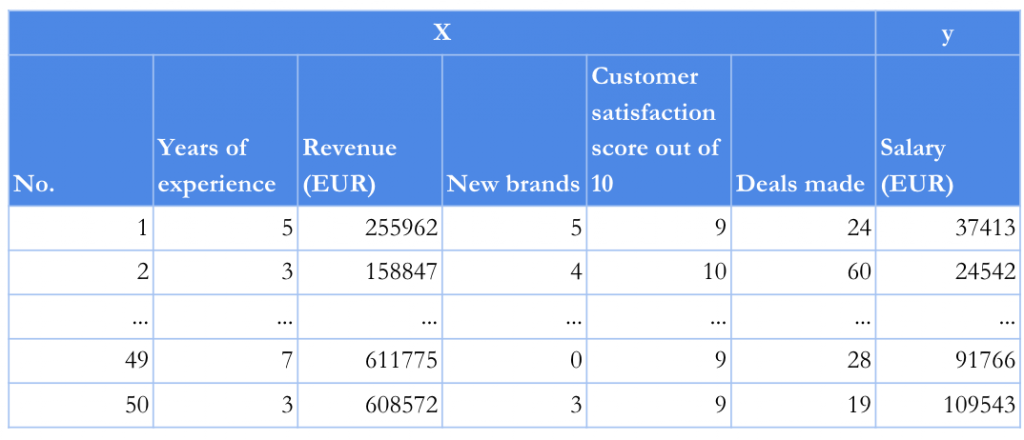
Imagine a company that works in sales and consists of 50 sales representatives who work hard to contribute to the company’s revenue growth. They definitely want to be treated fair and earn a salary which corresponds to their results.The sales manager of this company works hard to treat all employees justly. Years of experience in the industry helped him develop a general key performance indicator for the sales teams. The manager thinks that this indicator not only helps in making better decisions, but also provides insight which employees are more experienced and therefore are able to guide colleagues with less experience. Also, he introduced revenue as a KPI, which is one of the most important aspects that defines the success of the whole company and can be directly related to employee salary. New customers onboarded, their satisfaction score, and deals made by sales representatives are other important factors which are necessary to include in defining successful sales representative performance.
To sum up, these were the five key performance indicators, which the sales manager defined:
- Years of experience
- Revenue
- New customers (new brands)
- Customer satisfaction score
- Deals made
The sales manager created a spreadsheet where he listed all yearly results of the employees. A few sleepless nights and countless energy drinks later, the manager collected all employee performance information from the company’s electronic journals and filled the sheet bellow (thanks, Greg). After filling out the values of the key performance measurements, he started going through each of the lines by setting a salary. Lastly, he revisited all the salary cells to make sure that every employee is aligned well in comparison with others.
To make this easier, let’s start by working out how the salary is depended on the revenue. We will use the Python programming language to train the algorithm. To illustrate this example we will use Linear regression algorithms commonly used in predictive analysis. Regresssion models a target prediction value based on independent variables. It is mostly used for finding out the relationship between variables and outcome. In this example we will use historical revenue and other data as independent variables to predict what salary is most appropriate for each employee. The usage of linear regression algorithms make it easy to present the concept of Machine Learning for people who are not familiar with it.
Step 1 – Download and install tools
Let’s download Anakonda
The World’s Most Popular Python/R Data Science Platform
Step 2 – Import the libraries
import numpy as np # fundamental package for scientific computing with Python
import matplotlib.pyplot as plt # Python 2D plotting library
import pandas as pd # High-performance, easy-to-use data structures and data analysis tools for Python
import requests as r # Requests is a Python HTTP library
import io # Python’s main facilities for dealing with various types of input and output
Step 3 – Get the salary data from the web
# these lines of code get the data from the web url and fill the dataset
content = r.get(‘https://raw.githubusercontent.com/liumedz/simple-ai/master/50_Salaries.csv’).content
dataset = pd.read_csv(io.StringIO(content.decode(‘utf-8’)))
Step 4 – Select the data subset to train the algorithm
It’s quite similar to excel or other spreadsheet programs, where the data from columns and rows can be selected. To do this in Python we use the iloc[<rows>,<columns>] function. In the brackets we set the number of rows and columns separated by a comma.
X = dataset.iloc[:, 2].values
y = dataset.iloc[:, 6].values
First let’s use the revenue for algorithm input as X. To do that we have to select the third column by setting 2 in the iloc [:, 2] brackets and assigning it to the variable X.
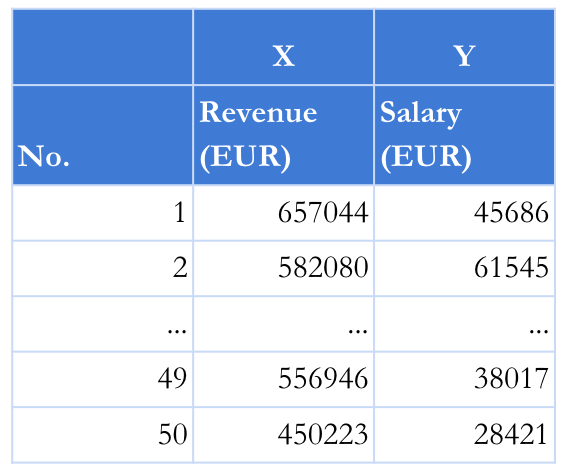
Secondly, we use the salary as a result by assigning it to the variable Y. The results of variables X and Y are presented in the table.
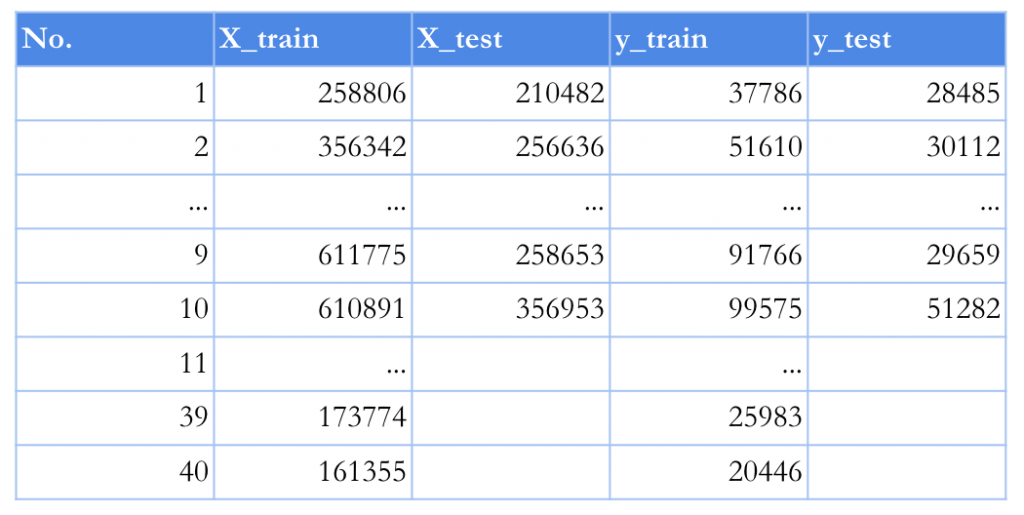
Step 5 – Splitting the data set into the Training set and the Test set
To train a computer to figure out what tendencies are used in creating the algorithm we have a set of 50 sales team salaries records. We also want to test whether a computer is as good at predicting as most humans are. To verify how well the algorithm performs we randomly take 10 percent of the data records . We will use them to verify or neglect our assumptions on algorithm performance in the future. We will use the other 90 percent of the records to train the algorithm.
from sklearn.model_selection import train_test_split
X_train, X_test, y_train, y_test = train_test_split(X, y, test_size = 0.2, random_state = 0)
Step 5 – Fit Linear Regression to the Training set
To fit linear regression to the training set we will use the linear_model from sklearn library. The fit method is used to train the model using the training sets.
from sklearn.linear_model import LinearRegression
regressor = LinearRegression()
regressor.fit(X_train, y_train)
Step 6 – Predicting the Test set results
To predict the test set results we will use the predict method from the LinearRegression library by setting X_test data in order to anticipate Y_test results
y_pred = regressor.predict(X_test)
Step 7 – Visualizing the Training set results
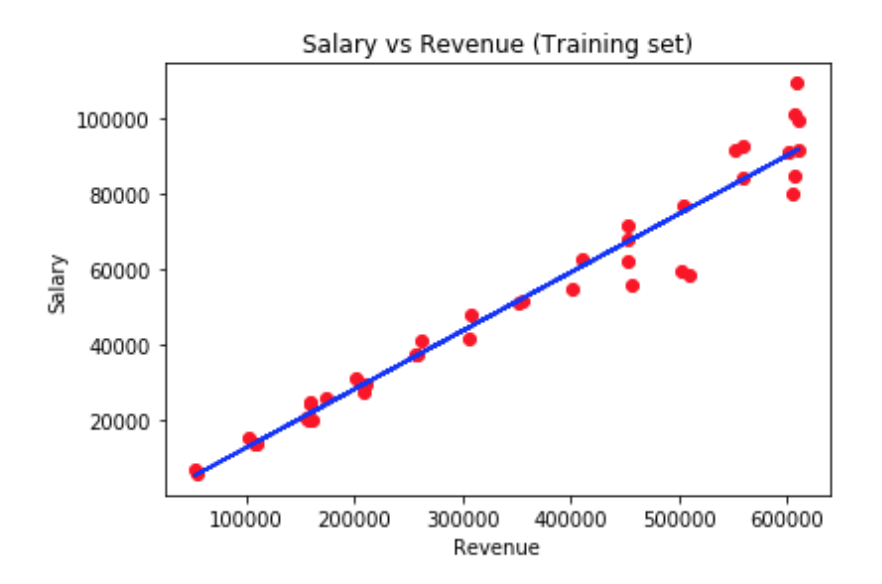
To visualize the training set results we will use the matplotlib.pyplot library. The blue line shows the salaries that would be predicted if we set a specific revenue. To put it simply, because the relation between the revenue and the predicted salary is linear the algorithm is called linear regression.
plt.scatter(X_train, y_train, color = ‘red’)
plt.plot(X_train, regressor.predict(X_train), color = ‘blue’)
plt.title(‘Salary vs Revenue (Training set)’)
plt.xlabel(‘Revenue’)
plt.ylabel(‘Salary’)
plt.show()
Step 8 – Visualizing the Test set results
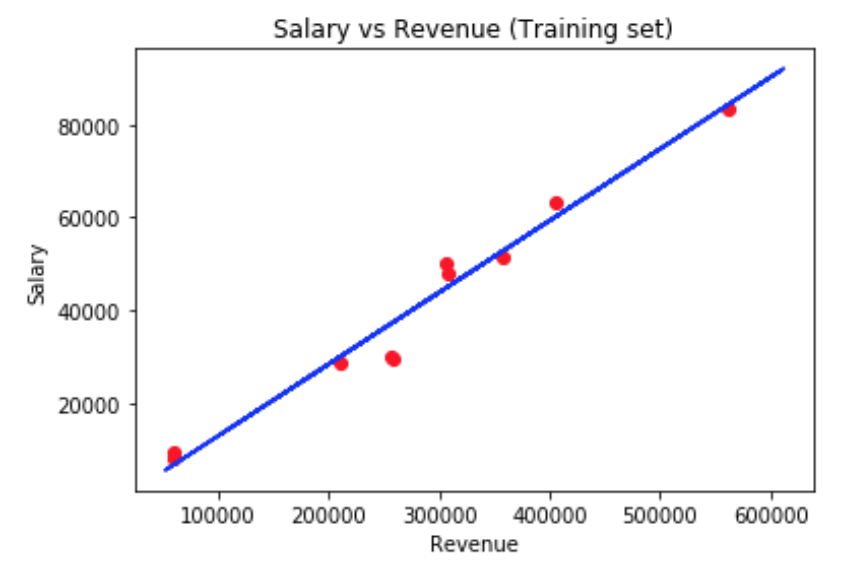
plt.scatter(X_test, y_test, color = ‘red’)
plt.plot(X_train, regressor.predict(X_train), color = ‘blue’)
plt.title(‘Salary vs Revenue (Training set)‘)
plt.xlabel(‘Revenue‘)
plt.ylabel(‘Salary’)
plt.show()
The test set helps verify how well the algorithm performs. We use a sample of the data records from the sales manager test set to compare the algorithms prediction accuracy. The blue line represents what salary would be predicted on specified revenue. The red dots represent the real t salary which has been set by the sales manager. Basically, the shortest distance from the red dot and the blue line proves the ability of the algorithm to predict the salary with a satisfying accuracy. The longer the distance between the line and the dot is the less accurate the prediction is.
The code
# Importing the libraries
import numpy as np
import matplotlib.pyplot as plt
import pandas as pd
import requests as r
import io
# Importing the dataset
content = r.get(‘https://raw.githubusercontent.com/liumedz/simple-ai/master/50_Salaries.csv’).content
dataset = pd.read_csv(io.StringIO(content.decode(‘utf-8’)))
X = dataset.iloc[:, 2:3].values
y = dataset.iloc[:, 6].values
# Splitting the dataset into the Training set and the Test set
from sklearn.model_selection import train_test_split
X_train, X_test, y_train, y_test = train_test_split(X, y, test_size = 0.2, random_state = 0)
# Fitting Multiple Linear Regression to the Training set
from sklearn.linear_model import LinearRegression
regressor = LinearRegression()
regressor.fit(X_train, y_train)
# Predicting the Test set results
y_pred = regressor.predict(X_test)
# Visualising the Training set results
plt.scatter(X_train, y_train, color = ‘red’)
plt.plot(X_train, regressor.predict(X_train), color = ‘blue’)
plt.title(‘Salary vs Revenue (Training set)’)
plt.xlabel(‘Revenue’)
plt.ylabel(‘Salary’)
plt.show()
# Visualising the Test set results
plt.scatter(X_test, y_test, color = ‘red’)
plt.plot(X_train, regressor.predict(X_train), color = ‘blue’)
plt.title(‘Salary vs Revenue (Training set)’)
plt.xlabel(‘Revenue’)
plt.ylabel(‘Salary’)
plt.show()
Step 9 – Let us multiple parameters
In step 4 as input parameters we used Revenue X and as an output parameter we used the Salary y. Let’s expand the amount of performance indicators and use all of the parameters which the sales manager uses.
To start using all of these parameters we need to adjust the code.
X = dataset.iloc[:, 1:5].values
y = dataset.iloc[:, 6].values
Now we assign the KPI’s data to the variable X from columns numbered 2 to 6 and predicted salary data from column 6 to variable y.
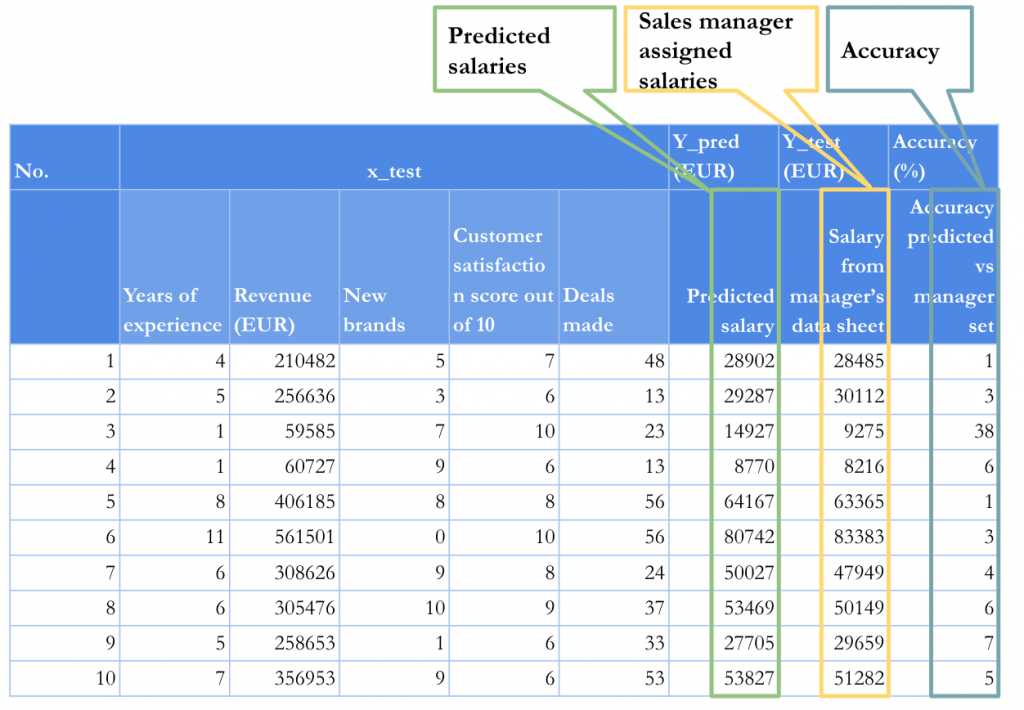
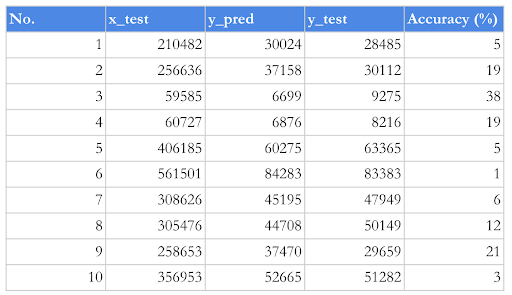
Basically from the results of the table we see that y_pred values 28902, 29287, 14927, 8770, 64167, 80742, 50027, 53469, 27705, 53827 correspond to the 10 percent randomly selected salaries from the sales manager data sheet 28485, 30112, 9275, 8216, 63365, 83383, 47949, 50149, 29659, 51282. As a matter of fact, we see that the algorithm predicted the salaries with a high accuracy percentage. The numbers are 1, 3, 38, 6, 1, 3, 4, 6, 7, 5. Only the salary of 9275 pops out from the trend with the accuracy of 38 percent. In this case, we can come to a conclusion that the salary of 9275 EUR is not so well set and does not fit into the multiple linear regression trend line.
In real cases of data science applications, scientists are using techniques like independent variable elimination to make sure that these variables truly have no impact to the results. If for example the new customers variable makes a low impact on the salary, it should be considered to remove it from the model. It is important to use cross-validation techniques to assess how the results of the statistical analysis will generalize to an independent data set. Testing is important to verify the behaviour of the model. The model should generate expected results with satisfying accuracy in all scenarios.
The code
# Multiple Linear Regression
# Importing the libraries
import numpy as np
import matplotlib.pyplot as plt
import pandas as pd
import requests as r
import io
# Importing the dataset
content = r.get(‘https://raw.githubusercontent.com/liumedz/simple-ai/master/50_Salaries.csv’).content
dataset = pd.read_csv(io.StringIO(content.decode(‘utf-8’)))
X = dataset.iloc[:, 1:6].values
y = dataset.iloc[:, 6].values
# Splitting the dataset into the Training set and Test set
from sklearn.model_selection import train_test_split
X_train, X_test, y_train, y_test = train_test_split(X, y, test_size = 0.2, random_state = 0)
# Fitting Multiple Linear Regression to the Training set
from sklearn.linear_model import LinearRegression
regressor = LinearRegression()
regressor.fit(X_train, y_train)
# Predicting the Test set results
y_pred = regressor.predict(X_test)
Conclusion
Machine learning is an application of Artificial Intelligence (AI) that provides systems the ability to automatically learn and improve from experience without being explicitly programmed. The more data we have , the better results we can expect. Machine learning focuses on the development of computer programs that can access data and use that data to learn. In this article, we have analyzed one of the main Machine Learning algorithms. Sales managers salaries history was used as data to train a simple multiple linear regression algorithm. This article proves that algorithms can not only predict the future results but also help us simulate the future, plan and make better decisions in such situations.
In this article, we have learned the principles of the linear regression algorithm which is one of the most used Machine Learning algorithms in the world of Artificial Intelligence. The algorithm itself is just a computer instructed to be able to use the data and apply some patterns to make our work easier. If specialists from different work fields would be able to understand the principles of Machine Learning algorithms, they could think of ways how these algorithms can contribute to the automation of daily business processes.